'Youth Jobs Gap: Establishing the Employment Gap', is the first report in the Youth Jobs Gap series.
Main findings
This new NIESR and Impetus report on young people not in education, employment and training (NEET) reveals that: Young people with a disadvantaged family background[1] are 50% more likely to be NEET than better-off peers irrespective of their education outcome.
[1] Based on Free School Meals eligibility in the final year of secondary school.
This finding holds for all age groups and also has not changed over time. For the first time, our data allows us to create reliable NEET statistics for the 18-24 year-olds in local areas, which show that local employment gaps between disadvantaged young people and others differ greatly and are unrelated to overall NEET rates.
As with previous studies, our findings confirm much lower NEET rates for 18-24-year old people with good GCSEs, A-Levels or Level 3 vocational qualifications.
Local differences in this “employment gap” indicate that some local areas are more successfully tackling the negative effects of disadvantage, which are unrelated to education success, on young people’s school-to-work transitions.
Our study demonstrates the great potential of administrative data to learn more about the school-to-work transition of young people, which local areas are successful and where we can learn from good practice.
Findings in detail
We analyse linked education and labour market data for 3,486,000 young people, i.e. the full biographies of practically everybody leaving state secondary schools between 2007 and 2012 in England. People having a NEET experience are all people not observed in the data with education and employment activity for a period of three months at any point in time.
For the most recent point in time (March 2017), our results show that young people with low qualifications are twice as likely to be NEET than those with 5 GCSEs (29% compared to 15%). People with A-Levels of Level 3 vocational qualifications qualified experiencing the lowest NEET rates (8%).
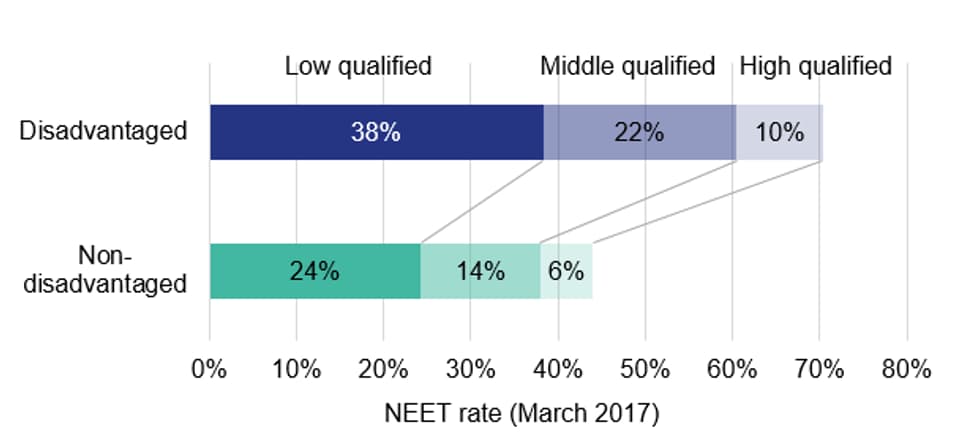
Young people with a disadvantaged family background are 50% more likely to be NEET than better-off peers. This is true at all levels of qualification (see Figure 1) and regardless of age. Also, it has not changed since 2010.
Figure 1: NEET rates in March 2017, by education level* at age 18

* Low: Fewer than 5 GCSEs (A*-C) or equivalent, middle 5 GCSEs (A*-C), high A-Levels or vocational education at Level 3. Source: Linked DfE education records and Longitudinal Education Outcomes data.
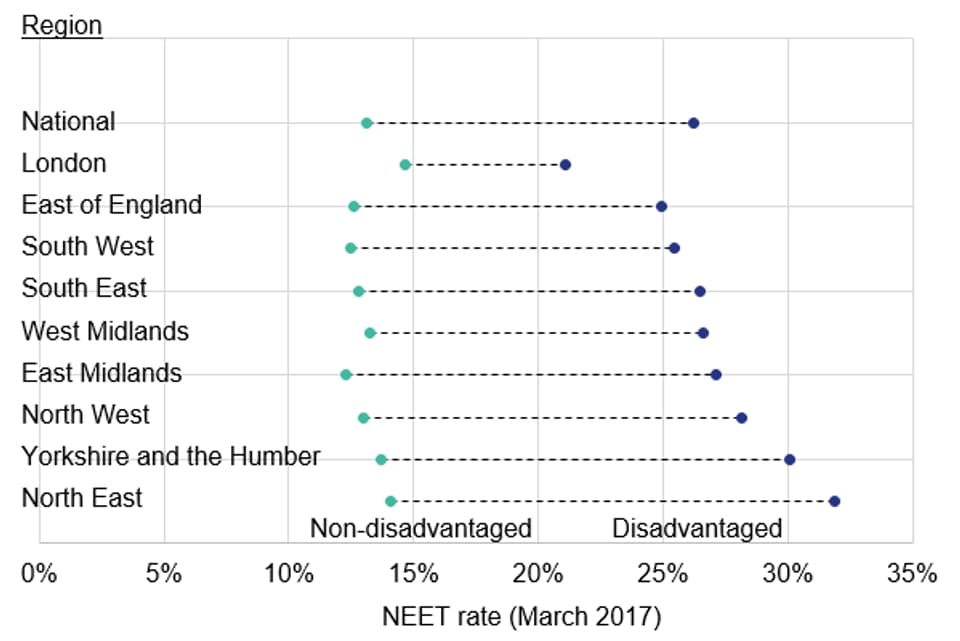
London has a much smaller gap between NEET rates of children from disadvantaged families and others (seven percentage points). A much wider gap is found for the North East: almost one third of all disadvantaged 18-24 year olds are NEETs in this region, compared to 14% of their better-off peers.
Figure 2: NEET rates in March 2017, by disadvantage* and region

*Disadvantage refers to free school meal eligibility in final year of secondary school. Source: Linked DfE education records and Longitudinal Education Outcomes data.
Local area differences
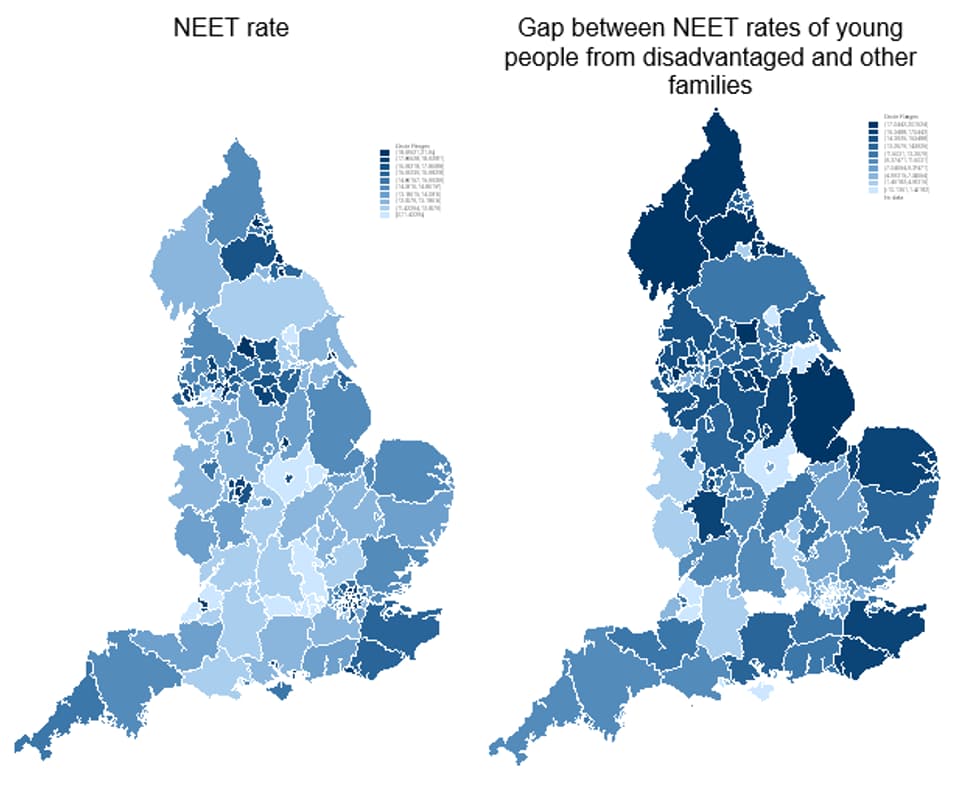
Two maps of England’s Metropolitan and non-metropolitan counties with NEET rates and the gap between disadvantaged and non-disadvantaged young people show the complexity in local patterns of the youth employment gap (Figure 3).
The first one, showing NEETs as % of the population of young people in March 2017, shows the local areas by how large NEET rates are, in deciles, with the darkest ones showing where NEET rates are highest. The highest NEET rates are usually found in the metropolitan centres like the Inner London Boroughs, Merseyside, Greater Manchester, Newcastle and Sheffield. There are also relatively high rates in coastal areas like Blackpool, Brighton and East Sussex.
The second map shows the gap between NEET rates of young people from disadvantaged families and others, with the darker shades indicating larger gaps, i.e. more inequality. In combination, they show no consistent pattern. There are urban areas with larger NEET rates and smaller employment gaps, but also small gaps in some areas having comparatively low NEET rates like Leicestershire and York.
Figure 3: Maps of NEET rate and employment gap in small areas, March 2017

Source: Linked DfE education records and Longitudinal Education Outcomes data.
How to improve the situation
The main conclusion from this analysis is that improving education outcomes is a necessary, but not sufficient condition to lower the disproportionately higher NEET rates of disadvantaged young people. Better local support for them and investment in e.g. youth employability services and careers advice are also very relevant.
By showing regional and local differences in the employment gap, we find evidence that some local areas are more successfully tackling the negative effects of disadvantage, which are unrelated to education success, on young people’s school-to-work transitions. From this point of view, the analysis of large data offers a great potential to see where local actors can achieve better outcomes and to learn from good practice.
Authors: Dr Stefan Speckesser, Dr Matthew Bursnall and Jamie Moore.
Tweet us @ImpetusUK @NIESRorg #YouthJobsGap
